


The modern R-Lab software
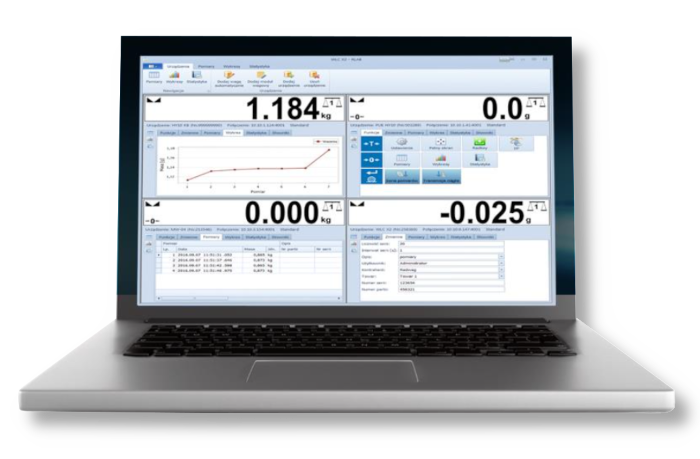
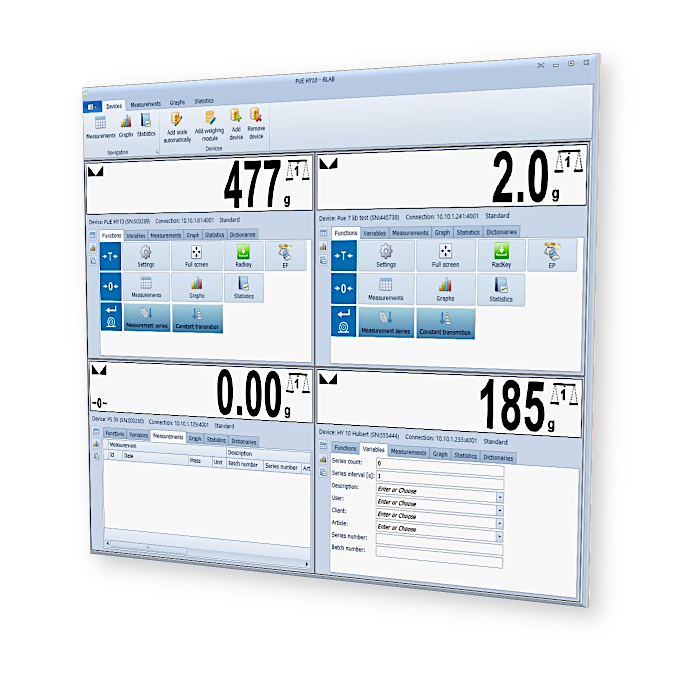
enables collecting, presenting and carrying out statistical analysis of measurements sent from RADWAG scales to a computer. The software operates with max 20 scales simultaneously. Data can be saved either manually or automatically.
Collected information is presented on reports in a form of complex tables, and via graphs.
Graph types:
- Measurement graph with statistics data
- Gaussian distribution function (probability distribution) and a histogram
- Stability graph – difference between successive measurements
- All in one graph
The software makes it possible to generate a report for a particular series of measurements and it offers various filtering options, i.e. filtering by date, mass, unit, description or list of selected devices. R-Lab also presents reports from an ongoing session and a current day.
Statistics created by the software include measurement quantity, minimum and maximum values, mean values, median, standard and mean deviation, variance, variance and deviation estimator and weighings sum. The data can be exported to PDF, HTML, MHT, RTF, XLS, XLSC, CSV, text and graphic files.
The latest software version: 2020.1.27
 Albanian
 Danish
 Nederlandse
 Estonian
 Finnish
 Hungarian
 Icelandic
 Kazakh
 Latvian
 Lithuanian
 Macedonian
 Norwegian
 Portuguese
 Romanian
 Russian
 Slovak
 Slovenian
 Swedish
 Ukrainian
 Serbian
 Montenegrin
 Português (Brasil)
 Deutsch
 Español
 Français
 Italiano
 Japanese (日本語)
 Polski
 Türkiye
 Česky
Česky 中文
中文


